Week 4
November 22, 2022
- Discard the first reading in both timeseries and FFT data.
- Write Liquid FFT to grafana. Put FFT in Node in hold.
- use the time of data RX for all entries corresponding to the measurement.
- Refine the current_timeseries table based on the new refactor.
- Create a table for Liquid FFT for the latest measurement.
- Create a widget in grafana for displaying FFT data from the step above.
- Deployment of Grafana in another environment.
- Setting up TDEngine tables with code itself.
- Insert BME and other sensor data into TDEngine.
November 23, 2022
- Issue with multiple sockets servers getting data.
- Reset the root node if the socket connection fails.
November 25, 2022
Discuss ESP32 code optimization methods (link)
discard the first ten measurements in LIS3DH and IIS3DWB.
Collimator: Graph the output of matlab vs collimator to compare.Collimator: Post data from Collimator to TDEngine cloud. We can explore the following approaches.Connecting data
Use CSV files directly from the Grafana CSV plugin
- Gave me an error in reading the CSVs locally and URL from the same files uploaded to Google drive. Used a small test csv file and got a similar error just for a different line. Will have to look further into this issue.
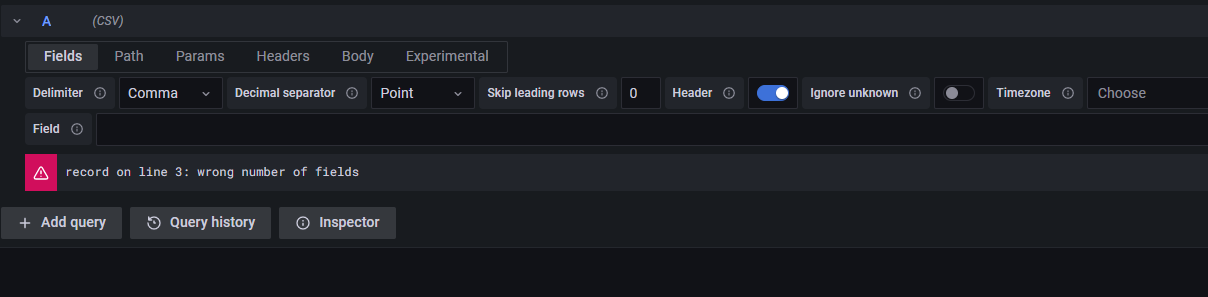
- Gave me an error in reading the CSVs locally and URL from the same files uploaded to Google drive. Used a small test csv file and got a similar error just for a different line. Will have to look further into this issue.
Send data to TDEngine cloud and connect grafana to TDEngine cloud.
Next: Send data from collimator simulation iteself to send data to TDEngine cloud via RESTful API from a python block.
Designing the dashboard
- Time column in the CSVs can be converted into timestamps. Then grafana feature to select the time range can be used to select the portion of the graph to display.
- A dropdown to select which attribute to display in matlab-collimator comparison. (same learnings can be utilized in displaying multiple nodes in the IoT dashboard)
November 28, 2022
- Creating Collimator vs. matlab comparison graph using TDEngine cloud and Grafana cloud.
- Show BME280 and temperature data in grafana.
- Explore TDEngine cloud and grafana cloud so the dashboard will be running in cloud.
- Format Raspberry Pi with ubuntu to replace the ubuntu laptop
- Insert current FFT data into TDEngine.
November 29, 2022
- Created Grafana cloud dashboard for sensor mesh using TDEngien cloud tables.
November 30, 2022
Sudhir, Ranjit
Moving forward with TDEngine cloud and Grafana cloud.
- TDEngine cloud plan info: https://cloud.tdengine.com/login
- Grafana cloud plan info: https://grafana.com/pricing/
- Free tier seems to allow upto 3 free users.
- Pro tier $8/user/month.
Sudhir suggested use of a single account
gqc@gqc.comand the credentials will be shared.
Commit linux_DSP_app code to github.
Finish Mesh to send sensor data + Socket server in C + TDEngine + FFT
- Send sensor data
- Socket server in C
- TDEngine database
- FFT application
- TDEngine timeseries tables should handle both 1024 and 2048 sized data. << Sample size will be constant for single deployment >>